Home / Dashboards & Data Viz
Dashboards & Data Viz
Make complex data legible. Good for: SaaS analytics, fintech, ops teams.
Examples
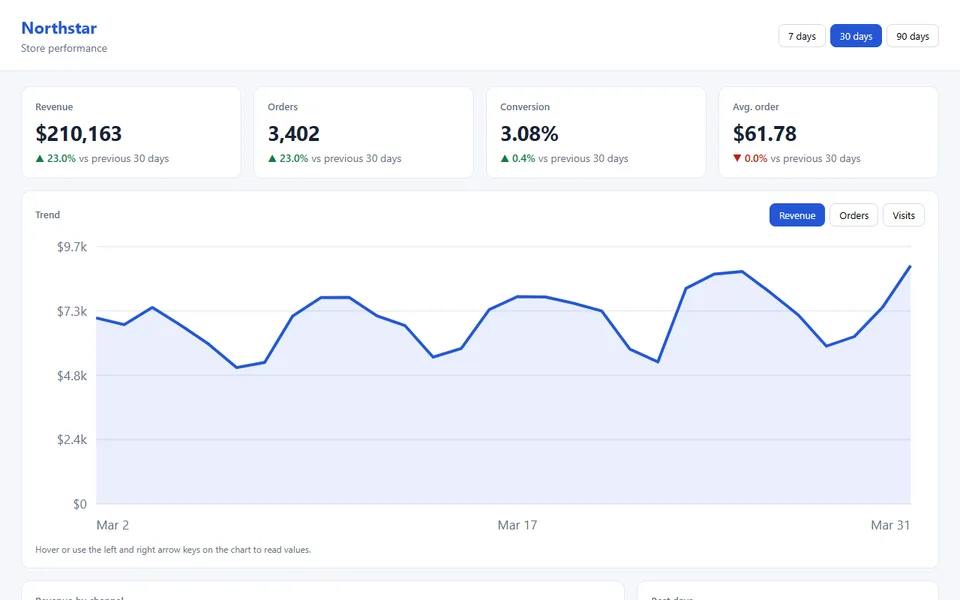
Northstar, Revenue Analytics
A store owner has the numbers in four tools and cannot tell at a glance whether this month is better than last.
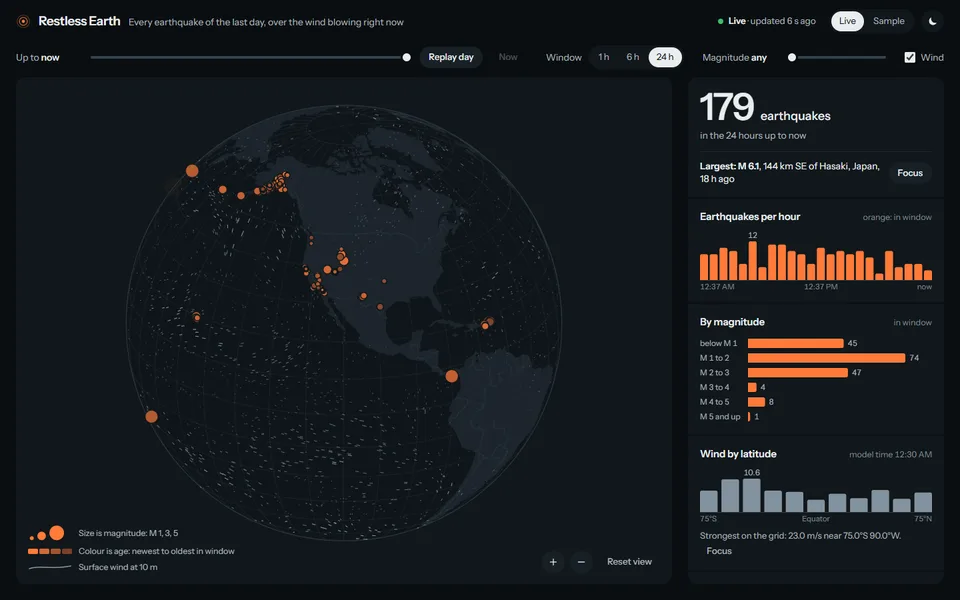
Restless Earth, Live Earthquake Globe
An ops or science team wants live data to feel alive and still be readable, with honest behaviour when the feed is down.
Need something like this?
Tell me what you're building and I'll tell you how I'd approach it.